Demography
Population (2011)
14,600
Census 2011
Area
1630.0 Ha
16.30 sq.km
Gross Density
9 PPH
Persons per Hectare
Wards/Villages
5
Outside BBMP
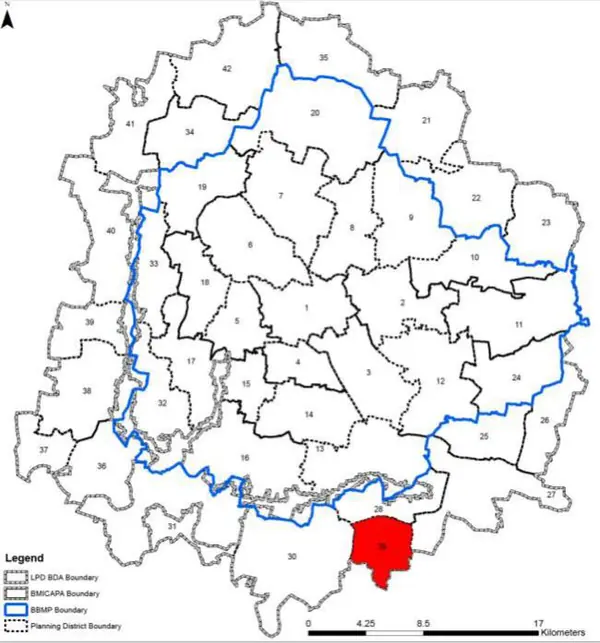
Extreme south of BMA, abutting Jigani-Bommasandra Industrial Area and Electronic City. 5 villages in Hulimangala GP. 74% decadal growth. 57.78% agriculture; quarry ~36 ha. IIHMR, few international schools. No metered water/sanitation.
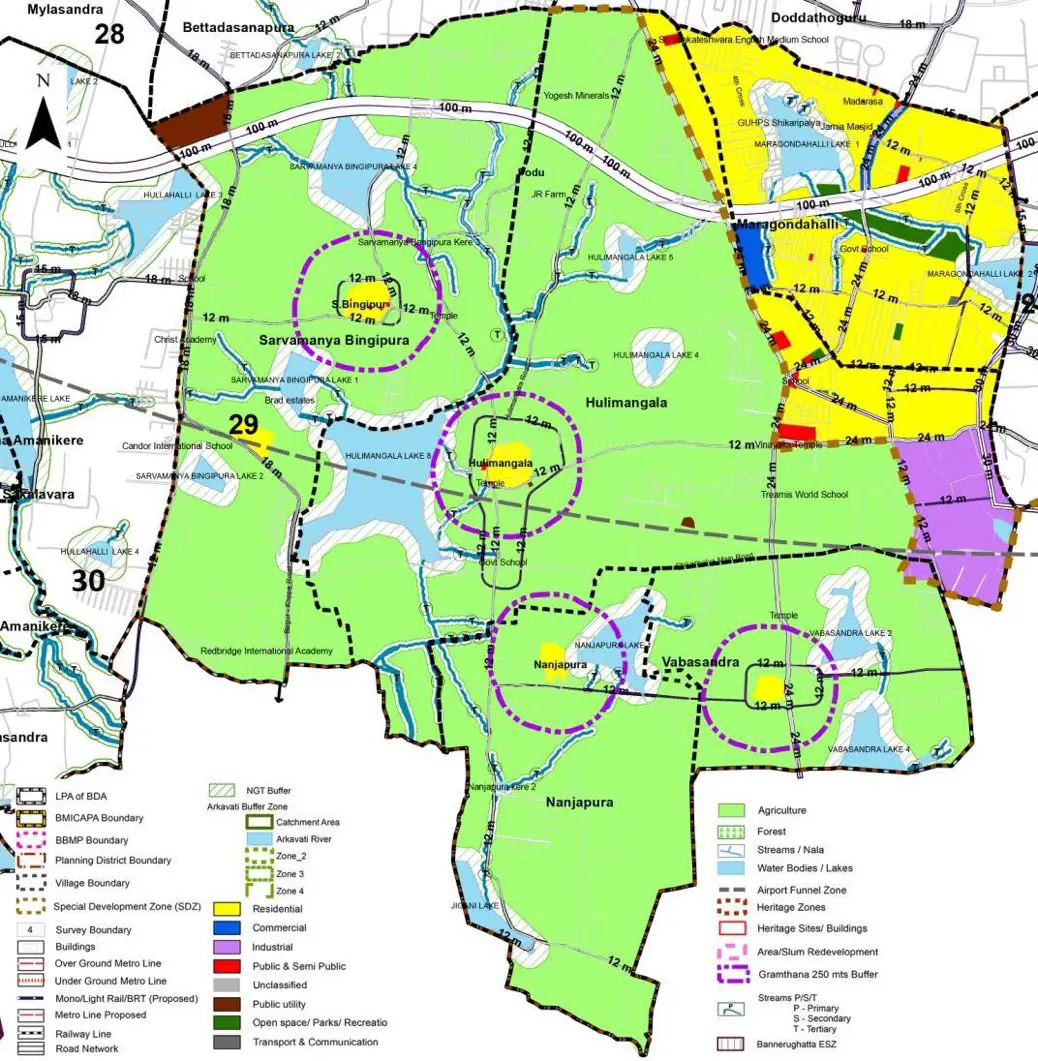
The Existing Land Use Map and Proposed Land Use Map for this PD are in the Planning District Report (PDF). Open the document and go to this PD’s section; use the List of Figures to find “PD 29 Existing Land Use Map” and “PD 29 Proposed Land Use Map”.
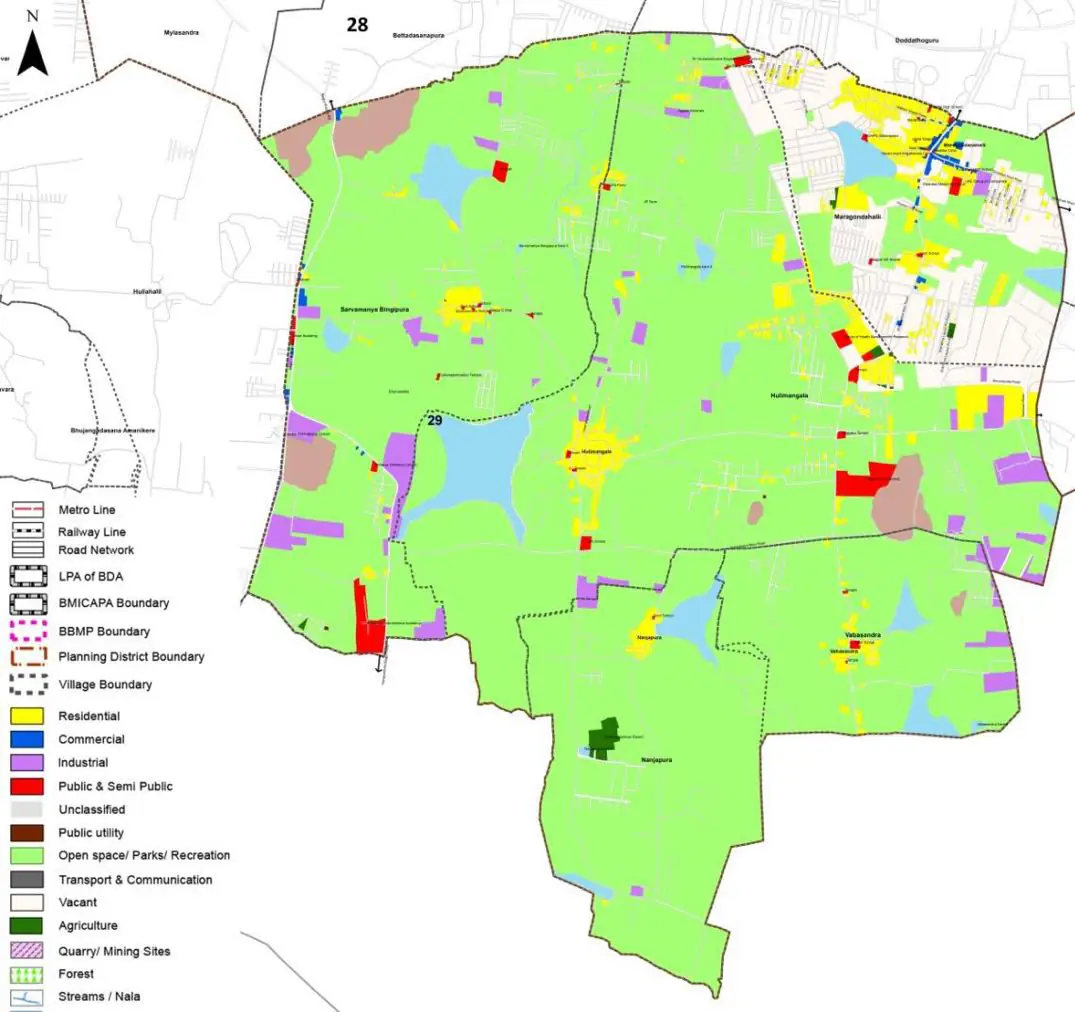
| Land use Category | Area (in Ha) | Percentage to Total Area (%) |
|---|---|---|
| Residential | 80.52 | 4.94 |
| Commercial | 3.59 | 0.22 |
| Industrial | 45.48 | 2.79 |
| Quarry/ Mining Sites | 35.70 | 2.19 |
| Public & Semi Public | 14.67 | 0.90 |
| Unclassified | 0.00 | 0.00 |
| Public Utility | 0.00 | 0.00 |
| Parks & Open Spaces | 3.42 | 0.21 |
| Transport & Communication | 62.98 | 3.86 |
| Vacant | 376.04 | 23.07 |
| Agriculture | 942.23 | 57.81 |
| Forest | 0.00 | 0.00 |
| Streams | 0.00 | 0.00 |
| Water Bodies | 64.71 | 3.97 |
| NGT Buffer | 0.00 | 0.00 |
| Other | 0.98 | 0.06 |
| Total | 1630.00 | 100.00 |
| Land use Category | Area (in Ha) | Percentage To Total Developable Area (%) |
|---|---|---|
| Residential | 875.64 | 53.72 |
| Commercial | 29.99 | 1.84 |
| Industrial | 192.50 | 11.81 |
| Quarry/ Mining Sites | 0.00 | 0.00 |
| Public & Semi Public | 12.88 | 0.79 |
| Unclassified | 0.00 | 0.00 |
| Public Utility | 0.00 | 0.00 |
| Parks & Open Spaces | 32.11 | 1.97 |
| Transport & Communication | 273.68 | 16.79 |
| Vacant | 0.00 | 0.00 |
| Agriculture | 0.00 | 0.00 |
| Forest | 0.00 | 0.00 |
| Streams | 0.00 | 0.00 |
| Water Bodies | 52.81 | 3.24 |
| NGT Buffer | 160.51 | 9.85 |
| Other | 0.00 | 0.00 |
| Total Developable Area | 1630.12 | , |
Total PD Area 1630.00 Ha. Source: Revised Master Plan 2031 (Draft) Volume-4.
Road Development Plan, Public Transport System, Multimodal Interchange Stations, Parks and Open Spaces, Protection and Rejuvenation of Lakes and Streams, Area Redevelopment, Heritage Area Protection and Conservation, Physical Infrastructure, Disaster Mitigation.